

Many high school coaches are stuck in old ways. They count points and rebounds, and guess based on what they see. It’s like they’re using box-score astrology.
Imagine if we changed how we think. Instead of focusing on who scored, we look at who made the team better. The team is like a living thing, and stats can’t show its true heart. The NBA and colleges use plus-minus data, but high schools are slow to catch on.
The truth is harsh: your top scorer might hurt the team on defense. And that quiet senior might be a game-changer, even if he doesn’t shoot much. This article will show you how to use data to improve your team without spending a lot.
Simple Data Capture: Bench Cards, Tablets, and Free Apps
In high school sports, simplicity is key. Today, we have a lot of data. But high school coaches only need a few points to make good decisions. It’s not about having a lot of data, but using it wisely.
Many schools spend a lot on fancy analytics software. But, it’s hard to use. The best data comes from simple tools like a legal pad and a stopwatch. Sometimes, the simplest tools are the best.
Here’s a minimalist toolkit that every high school coach should consider:
- A bench card with pre-printed lineup combinations
- A volunteer parent with a tablet running a free plus-minus app
- A sophomore manager who pays attention to the game
The key isn’t about the technology. It’s about being consistent. Track who’s on the floor and the score difference. Use Google Sheets for easy analysis.
Lineup data is simple: players either win their minutes or they don’t. Don’t get caught up in AI hype. Focus on the details and keep it simple.
| Tool | Purpose | Cost |
|---|---|---|
| Bench Card | Pre-printed lineup combinations | Low (printing costs) |
| Tablet App | Real-time plus-minus tracking | Free |
| Google Sheets | Data organization and analysis | Free |
For more tips on effective data collection, check out this resource on best data collection apps.
https://www.youtube.com/watch?v=1yX_JBJ-9gk
Metrics: Plus-Minus, Pace, eFG%, TOV%, REB Rates, Foul Tracker
Understanding metrics like plus-minus is key to winning. This simple number can mean a lot or nothing, depending on the situation. A player with a +8 in a blowout might not be as impressive as it seems without context.
Pace is important because it affects how a team plays. A team that loves fast breaks might struggle in slow games. It’s like putting a racehorse in a plow.
eFG% (effective field goal percentage) shows how good a team is at scoring. It takes into account that three-pointers are worth more than two-pointers. This is a big deal.
TOV% (turnover rate) shows how well a team keeps the ball. A high turnover rate is bad, like giving away candy. REB rates show who is good at getting rebounds and stopping the other team.
The foul tracker warns you when a player might get in trouble. It’s like a safety net for your best players. It helps prevent them from getting kicked out of the game.
On/off metrics show how much a player impacts the game. If your starting point guard leaves, does the team do better or worse? This can reveal a player’s true value. Plus, players who compete in small groups can improve by 18% to 27%.
| Metric | Description | Importance |
|---|---|---|
| Plus-Minus | Measures point differential when a player is on the court. | Identifies effective lineup combinations. |
| Pace | Number of possessions per game. | Influences game strategy and style. |
| eFG% | Adjusts field goal percentage for three-pointers. | Highlights scoring efficiency. |
| TOV% | Percentage of possessions ending in turnovers. | Indicates ball security. |
| REB Rates | Percentage of available rebounds secured. | Shows defensive effectiveness. |
Rotation Templates by Foul Trouble, Matchup, and Fatigue
A rotation template is more than a backup plan; it’s your strategic guide against chaos. High school rotations often feel like an improvised play, with coaches frantically checking fouls and scores. This approach is more like panic with a clipboard than a well-thought-out plan.
Rotation templates change this. They offer an if-then framework before the game starts. If your starting center gets two fouls early, you know exactly who to replace them with. It’s not about guessing; it’s about using data to find the best defensive combinations.
Matchup-based templates are even more effective. If your opponent uses a zone, you have a lineup ready with your top shooters and a high-post player. Facing a press? Use the team that excels against it. This foresight keeps you ahead.
Let’s talk about managing fatigue. Studies show that players in small groups with competition can boost their intensity by 18% to 27%. When three bench players come in together, they bring the teamwork from practice, preventing mistakes.
The template approach also prevents a common mistake: playing starters too long and then wondering why they fail in the fourth quarter. By planning rest times based on data, you keep players fresh for the game’s critical moments.
| Scenario | Template Strategy | Expected Outcome |
|---|---|---|
| Foul Trouble | Substitute based on foul counts | Maintain defensive integrity |
| Zone Defense | Utilize shooters and facilitators | Increase scoring efficiency |
| Fatigue Management | Rotate in groups of 2-4 | Preserve player chemistry |
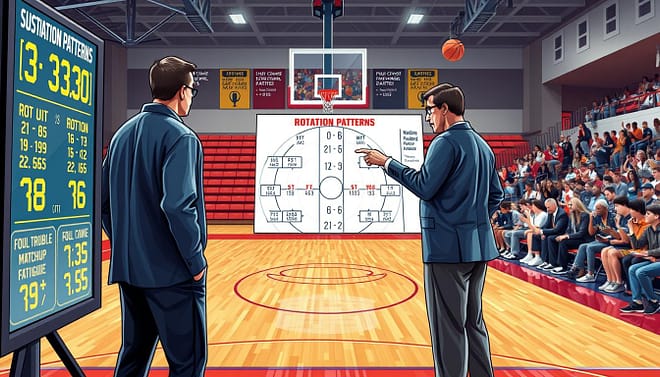
Using Timeouts and End Quarters for Lineup Edges
Timeouts in basketball are often overlooked, yet they hold the key to unlocking game-changing strategies. Most coaches treat them like fire extinguishers—only breaking glass in case of emergency. But here’s the kicker: the two possessions immediately following a timeout are among the highest-leverage moments in any game.
Why? Because both teams are organized, rested, and running set plays. The coach who deploys an optimized lineup for those possessions gains an edge that compounds across a season. It’s like having a secret weapon, but only if you know how to use it.
End-of-quarter situations are even more critical. The final two minutes of any quarter—specialy the second and fourth—represent disproportionate win-probability swings. Yet, I routinely watch coaches leave suboptimal defensive lineups on the floor with 45 seconds left in the half, surrendering easy baskets that erase an entire quarter’s worth of good work.
This is where on/off metrics become invaluable. Which five-man unit has the best defensive rating in short-clock situations? Which lineup generates the highest-quality looks against set defenses? These aren’t just philosophical questions; they’re empirical ones, answerable with nothing more than a well-kept bench chart and a willingness to trust the patterns.
Just like Formula 1 teams optimize pit-stop windows through data, basketball coaches should optimize substitution timing around stoppages. Sub during a timeout, not on the fly. Enter the quarter with your best two-way lineup. Exit the half with your best defensive unit. These micro-decisions feel trivial in the moment but separate winning programs from the also-rans.
- Utilize timeouts strategically: They can shift momentum.
- End-of-quarter management: Optimize your lineup for critical moments.
- Leverage on/off metrics: Know your best combinations.
Role Communication: Sixth Man, Stopper, Spacer, Cleaner
Players perform better when they know their roles. Unclear roles can harm team spirit. Each player needs to understand their part in the team’s success.
The sixth man is more than just a bench player. They are key in linking the starting and second units. This role is important and should be valued.
The stopper’s job is to stop the opponent’s best shooter. Their success is measured by how well the opponent scores when they’re on the court. Players should be proud of their role in defending the team.
The spacer changes the game by just being there. They don’t always touch the ball but make a big difference. Look at the team’s paint-point percentage with and without them to see their impact.
The cleaner does the hard work. They grab rebounds, dive for balls, and take charges. Their efforts are seen in rebounding rates and fouls drawn. Celebrating these shows how important their role is.
Creating a competitive yet supportive team is key. Each player should have a role they can own and be proud of. This clarity leads to better performance and teamwork.
Coaches must clearly communicate these roles. They should celebrate the right metrics and adjust as needed. This way, everyone knows their value and works together better.
| Role | Key Responsibility | Impact Measurement |
|---|---|---|
| Sixth Man | Bridge between units | On/Off offensive rating |
| Stopper | Neutralize top scorer | Opponent’s eFG% |
| Spacer | Change defensive rotations | Paint-point percentage |
| Cleaner | Gritty plays | REB rate, fouls drawn |

Film Plus Chart: Postgame Review Routine and Feedback Loop
Film analysis and lineup metrics come together in the postgame review. Here, lineup analytics HS turns into real, useful information. But, many coaches make a big mistake. They treat film and data as if they’re different languages. But, they tell the same story in different ways.
Right after the game, it’s key to compare the lineup chart with the game film. That -12 run in the second quarter? Look at every play. You’ll find the same mistakes over and over again. Maybe it’s a missed rotation or a spacing issue. Or maybe it’s just tiredness.
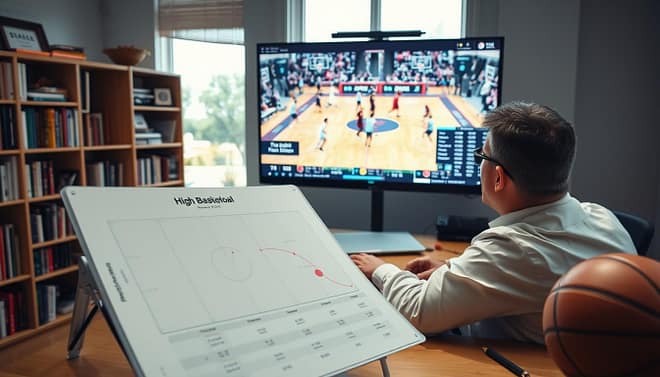
It’s also important to talk to the players about what happened. Show them the data and explain it with film. For example, “Your on/off numbers show the defense is 8 points better when you’re in. Here’s the film showing how your closeouts lead to tough jumpers instead of drives.” This way, it’s not just numbers; it’s real and motivating.
Players need to know what’s being measured and why. If a reserve guard knows his main goal is to have a good assist-to-turnover ratio, he’ll focus on passing instead of shooting. This routine also uncovers patterns that might not be seen in just one game. Maybe a lineup does great in the first half but falters later. This could mean a conditioning or adjustment issue.
Guardrails: Small Samples, Opponent Strength, Blowout Noise
Understanding lineup analytics shows us the limits of small samples in high school sports. With only 22 games in a season, the data can be misleading. A lineup with a +15 rating over 18 minutes might have played the bench during garbage time. In this world, context is key.
Statistical significance doesn’t stand alone. You must look at the opponents faced. A +10 net rating against a 4-18 team tells you little about facing a top team. Use a tier system to improve your analysis.
Blowout noise is another challenge. Fourth-quarter minutes when the game is over? Remove them from your analysis. They’re like exhibition games in real uniforms—fun but not telling.
Watch out for cognitive bias. Coaches might believe a lineup “works” too soon. To avoid this, set sample-size thresholds. Don’t make decisions based on one game’s data. Aim for at least 40 possessions before making any decisions. Lineup analytics is a guide, not a GPS. It helps, but human judgment is needed to understand the game.
| Factor | Impact on Data | Recommendation |
|---|---|---|
| Sample Size | Can lead to misleading conclusions | Analyze over 40 possessions |
| Opponent Strength | Affects the validity of performance metrics | Weight data by opponent quality |
| Blowout Noise | Distorts performance insights | Exclude garbage time minutes |
Case Study: A Texas District Program Before vs After Data Use
In a Texas high school, lineup analytics changed a basketball team. Clear Brook, a 5A team in Houston, was once a .500 team. They had talent but struggled to win big games.
The coach made decisions based on feelings, not facts. The top scorer played too much, hurting the team’s defense. The sixth man was unhappy and thought about leaving.
An assistant coach, a former college walk-on, suggested tracking the team’s play. They used a simple bench card and a Google Sheet. After six weeks, they found a surprising lineup that worked best.
This lineup, with a defensive junior and two role players, had a +14.3 net rating. It was a small sample but showed promise. The coach adjusted, making sure everyone played a role.
The leading scorer played less but was part of a strong defensive unit. The sixth man became the “energy lineup” player, showing his worth. The team’s record improved, and they won a district title.
They went from a team based on reputation to one based on performance. Players were happy because their roles were clear. This success story shows the power of using data to improve a team.
| Season | Record | Top Player Minutes | Team Rating | Transfers |
|---|---|---|---|---|
| Year 1 | 12-12 | 30 | – | 3 |
| Year 2 | 24-8 | 28 | +14.3 | 0 |
Starter Kit: Spreadsheets, Shot Charts, and Meeting Cadence
Starting lineup analytics HS is easy with a basic toolkit. Forget the fancy tech that might confuse even tech-savvy coaches. A simple Google Sheet is all you need. Set up a lineup tracker with columns for date, opponent, player initials, and more.
This can be done in about 45 minutes. Share it with your team and update it after each game.
Shot charts are next. A simple half-court diagram works well. Mark where shots are made and missed. This will show if your team is relying too much on mid-range shots.
Mid-range shots are often not the best strategy.
Then, there’s the meeting cadence. Have a 20-minute huddle the day after each game to review data and film. This keeps everyone in sync. Spend 45 minutes every Sunday planning the week’s rotation templates based on upcoming opponents.
Training your staff on data capture is key. If they don’t understand what’s being measured and why, your insights won’t be useful.
Emotional management is also important. Some players might not like data-driven decisions. Prepare your staff for constructive conversations. This starter kit costs little more than time and attention.
The benefits, like more wins and a stable program, are worth it.