

In high school basketball, knowing high school basketball stats is key. Imagine giving a generic stat sheet to a freshman and a senior. It’s like giving a map meant for a submarine captain to a fighter pilot. It’s useless for one of them.
Before diving into advanced stats, we must understand each player’s role. A center grabbing ten boards is different from a guard. We need to measure the impact, not just count the actions. Too often, promising careers are overlooked because of wrong grading.
This section aims to clarify the stats on the court. We’ll look at how to assign stats based on position, moving past the old “1 through 5” way. We’ll explore roles like the lead guard, off-guard, wing, hybrid forward, and true big. Is your wing a 3-and-D specialist or a secondary creator? The stats may look the same, but the advanced metrics tell different stories.
By the end of this section, you’ll have more than a roster. You’ll have a portfolio of specific, measurable roles. A point guard’s assist-to-turnover ratio is more than a number; it’s a guide. A center’s rebounding percentage shows their will, not just their height. Welcome to the new age of basketball analytics!
What to measure minutes usage eFG TS AST TO REB BLK STL per 32 possessions
Forget about points per game; it’s time to dive into deeper metrics. Welcome to the analytical deep end, where counting stats are replaced by efficiency metrics. If you’re judging a player by points per game, you’re using an outdated method.
The key number here is 32. This is the average possessions a high school team gets per half. Normalizing stats to “per 32 possessions” makes everything fair. It adjusts for pace, stall tactics, and limited playing time.
Let’s break down the alphabet soup:
- eFG% (effective field goal percentage): A three is worth more than a two.
- TS% (true shooting percentage): Drawing fouls is a skill, not luck.
- Usage Rate: It’s not just about selfishness, but trust and influence on offense.
And don’t forget the “hidden” stats. These include hockey assists, deflections, and box-outs. They show who really makes a difference, not just who scores.
I’ll guide you on how to build a “possession calculator.” It will show who’s truly efficient and who’s just shooting a lot. For more on these terms, check out the NCAA Statistics Service’s definitions.
Shot charting zones decision quality and assisted vs unassisted rates
When we talk about shot charting, we’re really discussing the art and science of basketball IQ. It’s not just about coloring in zones on a diagram. It’s about understanding the anatomy of a decision.
A shot chart is like a Rorschach test for a player’s basketball understanding. Give me 30 seconds with a heat map, and I’ll tell you if a kid understands geometry or if they think they’re the second coming of a 90s isolation scorer.
The NCAA’s policy on changing official statistics after a game—requiring indisputable video evidence for non-judgmental calls—mirrors the cold, hard truth of a shot chart. The film doesn’t care about your feelings. A contested long-two is a mistake, regardless of whether it went in. We’re applying that same “indisputable evidence” standard to shot selection.
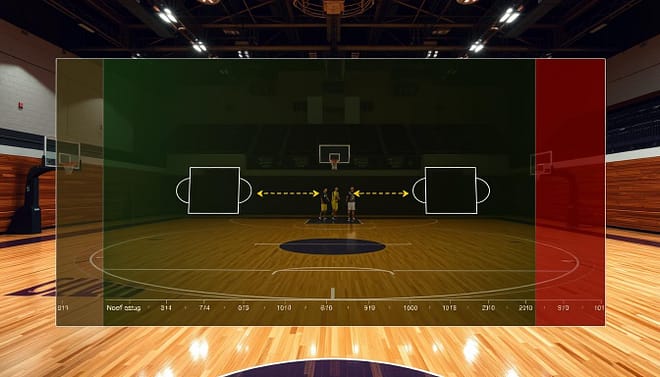
Let’s break down the floor into the zones that actually matter: the restricted area (the land of the giants), the paint (the floater range), the mid-range (the analytics-scarred wasteland), and the three-point line (broken into above-the-break and corner). But the real gold lies in the “assisted vs. unassisted” rate. A high unassisted rate on made threes screams “shot creator.”
On the other hand, a high assisted rate on rim attempts shouts “smart cutter.”
We’ll also discuss how to log “good misses” versus “bad makes.” Because let’s face it, a player who banks in a contested 18-footer didn’t make a good play; they just got lucky. This data is key for killing the ego and saving the season.
A 40% shot from the wrong zone is a losing formula, while a 30% look from the right spot might just be a goldmine waiting to mature.
For a deeper dive into these analytics, check out this insightful resource on basketball statistics.
Growth standards guards wings bigs ladders
In basketball, growth standards are key for players growing physically. Puberty can change a player’s size and skill quickly. If you don’t plan for this, you’re just guessing, not training.
Now, let’s talk about “Growth Ladders.” These are special goals for guards, wings, and bigs. They help track players’ growth in different ways. Each position has its own path to follow, with development KPIs to measure progress.
- Guards: Moving from fast to smart is key. Their KPIs should show this change.
- Wings: Growing from a one-way driver to a three-level scorer is important. They need new skills and ways to measure success.
- Bigs: Changing from a one-way player to a pick-and-pop expert is essential. KPIs should encourage trying new things, even if they fail.
Jacob Garcia’s wrestling career is a good example. He went from a small freshman to a big senior. He learned new moves for his new size. Basketball players must do the same, adapting to their growth.
The “Sophomore Slump” is not a curse, but a sign of growth. At 16, it’s good to try new things, even if they don’t work. This approach is more important than winning.
We’re looking at the player’s future, not just their current age. We want to help them grow, both physically and mentally, for the next level.
Practice tracking make charts competitive games and pressure reps
In the quest for basketball excellence, practice tracking is key. The JV recognition source highlights “Skill Development Milestones” and tracking progress. Remember, games are just snapshots; practice is the detailed story.
Practice includes “pressure reps,” like free throws after sprints. A simple “make chart” logs makes versus misses in context. This shows more than just numbers.
The game often shows only the highlights. But practice shows the real work. If you don’t track the effort, you’re missing out. This section celebrates the often-overlooked “make chart.”
We’re not just counting points; we’re tracking the effort behind them. A free throw made after a sprint is more valuable than one in a quiet gym.
Let’s track “competitive games” in practice. Think of 3-on-3 drills, 1-on-1 closeouts, and transition defense stops. A player’s practice record in drills often predicts their varsity performance better than their JV stats.
Why? It’s not just about the numbers; it’s about how they perform under pressure.
Introducing the “Pressure Rep Index,” a simple formula for tracking performance against fatigue. This is the data varsity coaches rely on. It answers the question: “What happens when this kid is tired, the game is tied, and the coach is screaming?”
The stat sheet from last Friday night won’t tell you that. But a well-kept practice log will.
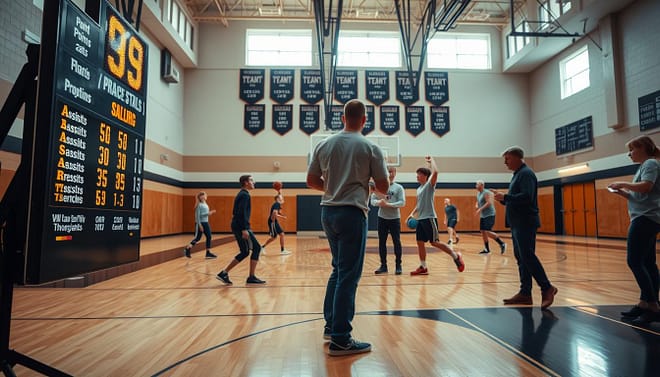
Tracking these elements gives players and coaches valuable insights. It allows for tailored training and helps identify areas needing improvement. So, embrace the grind, keep those charts, and remember: practice is where champions are made.
For more insights into basketball development, check out Texas Basketball Magazine.
Video tagging free and low cost tools logging plays and mistakes
Let’s explore the world of video tagging, where every frame has a story. In basketball, the film doesn’t lie, but it needs tags to remember. Watching a game is like a data entry job, not a movie night. Luckily, you don’t need an NBA budget to start.
With a smartphone, a tripod, and a free account on Hudl Assist, you can make recordings valuable. You can also use a well-organized YouTube playlist for tagging. The aim is to log “hustle plays” and “defensive mistakes” per possession, like a game statistician.

Every missed defensive rotation, every “my bad” moment, and every overlooked hockey assist can be tagged. This turns “per possession” into a detailed look at performance. I’ll show you how to create a “mistake taxonomy” to categorize errors.
A player with high physical mistakes but low effort mistakes? That’s a project worth investing in. On the other hand, a player with low physical errors but high effort mistakes might have a culture problem. We can then use these tags to create a Hustle Score for unsung heroes.
This is about giving a statistic to the dive on the floor, the deflection that sparked a fast break, and the box-out that freed up a rebound. Video tagging is more than logging plays; it’s about capturing the game’s heart and hustle.
Reporting templates for coach player parent meetings
In youth sports, clear communication is vital, like in coach-parent meetings. Imagine walking into a meeting with a detailed report on your child’s progress. This is what we aim for. Giving a raw Excel sheet to a parent is overwhelming and can be misleading.
We’re creating a “Player Progress Report” that’s easy to understand. The top part will show the “Role Identity” of each player. This helps everyone understand their role. The middle section will have a “Development KPI Dashboard” to track player growth.
Color coding is key here. Red means “below the line,” yellow means “on track,” and green means “varsity ready.” This makes it easy for parents to see how their child is doing without getting lost in numbers.
The bottom part of the report is the “Film Room” section. It includes a QR code for a playlist with three clips. One shows a great play, one a mistake, and one a growth moment. This makes meetings more engaging and shows we have a solid plan.
These reporting templates help turn tough meetings into team efforts. We’re saying, “We have a plan, we have data, and your kid is a project with a clear path.” This builds trust and teamwork, making sure everyone is working together for player growth.
Quarterly review questions and goal resets
A quarterly review is not just a formality; it’s a key moment. It’s like the NCAA’s strict rules for changing stats, needing clear video proof and agreement within a week. We don’t change goals just because of one bad game. We look at all the evidence from the quarter.
We examine the shot chart from October and compare it to December. Has the mid-range addiction been fixed? Are there more assisted rim attempts? We ask hard questions: “The data shows you’re a 45% shooter from the right corner, yet you keep shooting from the left. Why do you sabotage your own success?”
We also look at the “error tags” from our video breakdown. If mental mistakes keep happening, it might not be about physical training but about watching film. This is where we stop bad habits before they become permanent.
Our goal is to set “process goals” for the next quarter. Instead of vague targets like “score 20 points,” we aim for specific goals. For example, “touch the paint 10 times per 32 possessions” or “keep your matchup under 0.8 points per possession.” This ensures the player’s scouting report stays up-to-date.
| Quarter | Shot Chart Analysis | Video Error Tags | Process Goals |
|---|---|---|---|
| Q1 | Mid-range shots: 35% | 5 major errors | Touch paint 8 times |
| Q2 | Mid-range shots: 25% | 3 major errors | Touch paint 10 times |
| Q3 | Mid-range shots: 20% | 2 major errors | Touch paint 12 times |
Turning data into recruiting context and character story
In high school basketball, numbers tell a story. But it’s the story behind those numbers that really grabs college coaches’ attention. Jacob Garcia is a great example. His story is not just about his achievements; it’s about his journey of overcoming obstacles.
As a 112-pound freshman, he was overshadowed by a legend. But he worked hard and gained 55 pounds. This change didn’t just improve his game; it made him unstoppable.
College coaches don’t want your stats in a spreadsheet. They have teams for that. What they want is the story your stats tell. It’s about showing growth, adaptability, and a bright future.
Did a poor shooting percentage as a sophomore mean you were playing too high? That’s not a bad thing. It shows courage and quick learning.
Think about when a star player got hurt, and your assists went up. That’s not just a stat; it shows leadership. We use the “Jacob Garcia” model to show how early struggles and growth are key.
When emailing coaches, make your emails stand out. Instead of saying, “6’2” guard averages 15 PPG,” say, “See how this guard’s decision-making improved over 2,000 possessions.” This makes you more than just a number; you become a top recruit.
Sample dashboards printable progress sheet and glossary
Welcome to a toolbox that turns theory into action. We’re exploring sample dashboards that make tracking development KPIs fun. It’s not just paperwork; it’s a tool for everyone involved.
The “Varsity Readiness Dashboard” is a colorful tool. It shows players how they’re doing against growth ladders. It’s a visual guide to progress, helping spot areas to improve.
The “Weekly Progress Sheet” lets players track their own journey. They log shooting percentages, sleep, and effort scores. It’s a way to understand themselves better.
The “Parent-Friendly Glossary” makes complex terms simple. It explains stats like “1.02 points per possession” in easy words. This helps parents grasp their child’s performance easily.
These dashboards grow with players. They help track progress from freshman to varsity star. It’s where data meets action, turning numbers into stories that motivate and guide.